ADF 12c (12.1.3) is shipped with completely rewritten DVT components, there are no graphs anymore - they are called charts now. But there are much more, besides only a name change. Previous DVT components are still running fine, but JDeveloper wizards are not supporting them anymore. You should check ADF 12c (12.1.3) developer guide for more details, in this post I will focus on line chart overview feature. You should keep in mind, new DVT chart components do not work well with Google Chrome v.35 browser (supposed to be fixed in Google Chrome v.36) - check JDeveloper 12c (12.1.3) release notes.
Sample application - ADF12DvtApp.zip, is based on Employees data and displays line chart for the employee salary, based on his job. Two additional lines are displayed for maximum and minimum job salaries:
![]()
Line chart is configured with zooming and overview support. User can change overview window and zoom into specific area:
![]()
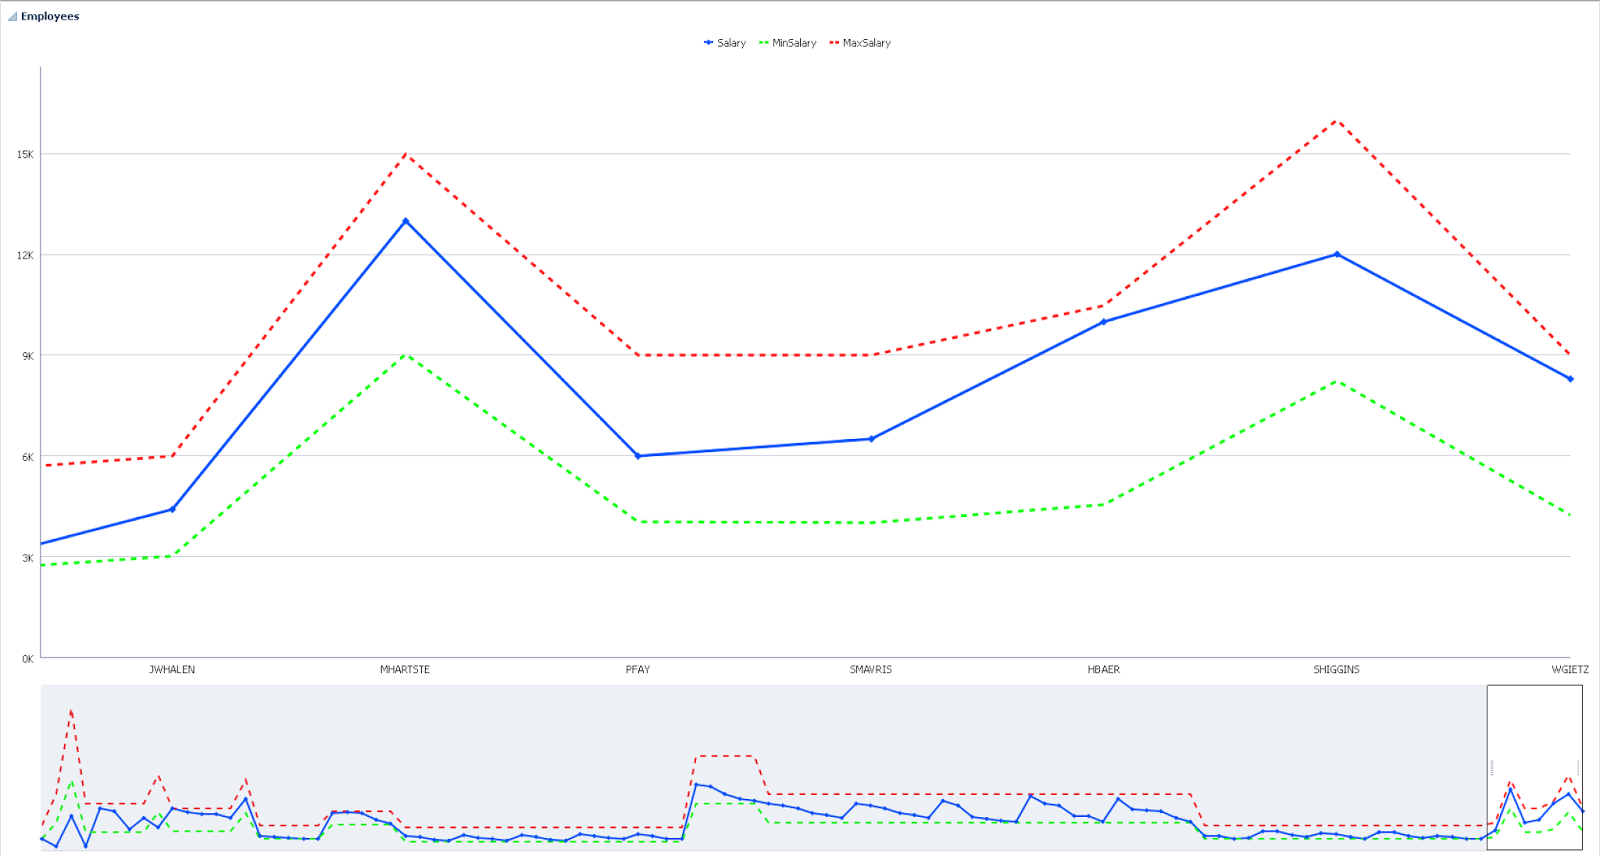
This helps a lot to analyse charts with large number of data points on X axis. User can zoom into peaks and analyse data range:
![]()
One important hint about new DVT charts - components should stretch automatically. Keep in mind -parent component (surrounding DVT chart) should be stretchable. As you can see, I have set type = 'stretch' for panel box, surrounding line chart:
![]()
Previous DVT graphs had special binding elements in Page Definition, new DVT charts are using regular table bindings - nothing extra:
![]()
Line chart in the sample application is configured with zooming and scrolling (there are different modes available - live, on demand with delay):
![]()
Overview feature is quite simple to enable - it is enough to add DVT overview tag to the line chart, and it works:
![]()
Sample application - ADF12DvtApp.zip, is based on Employees data and displays line chart for the employee salary, based on his job. Two additional lines are displayed for maximum and minimum job salaries:
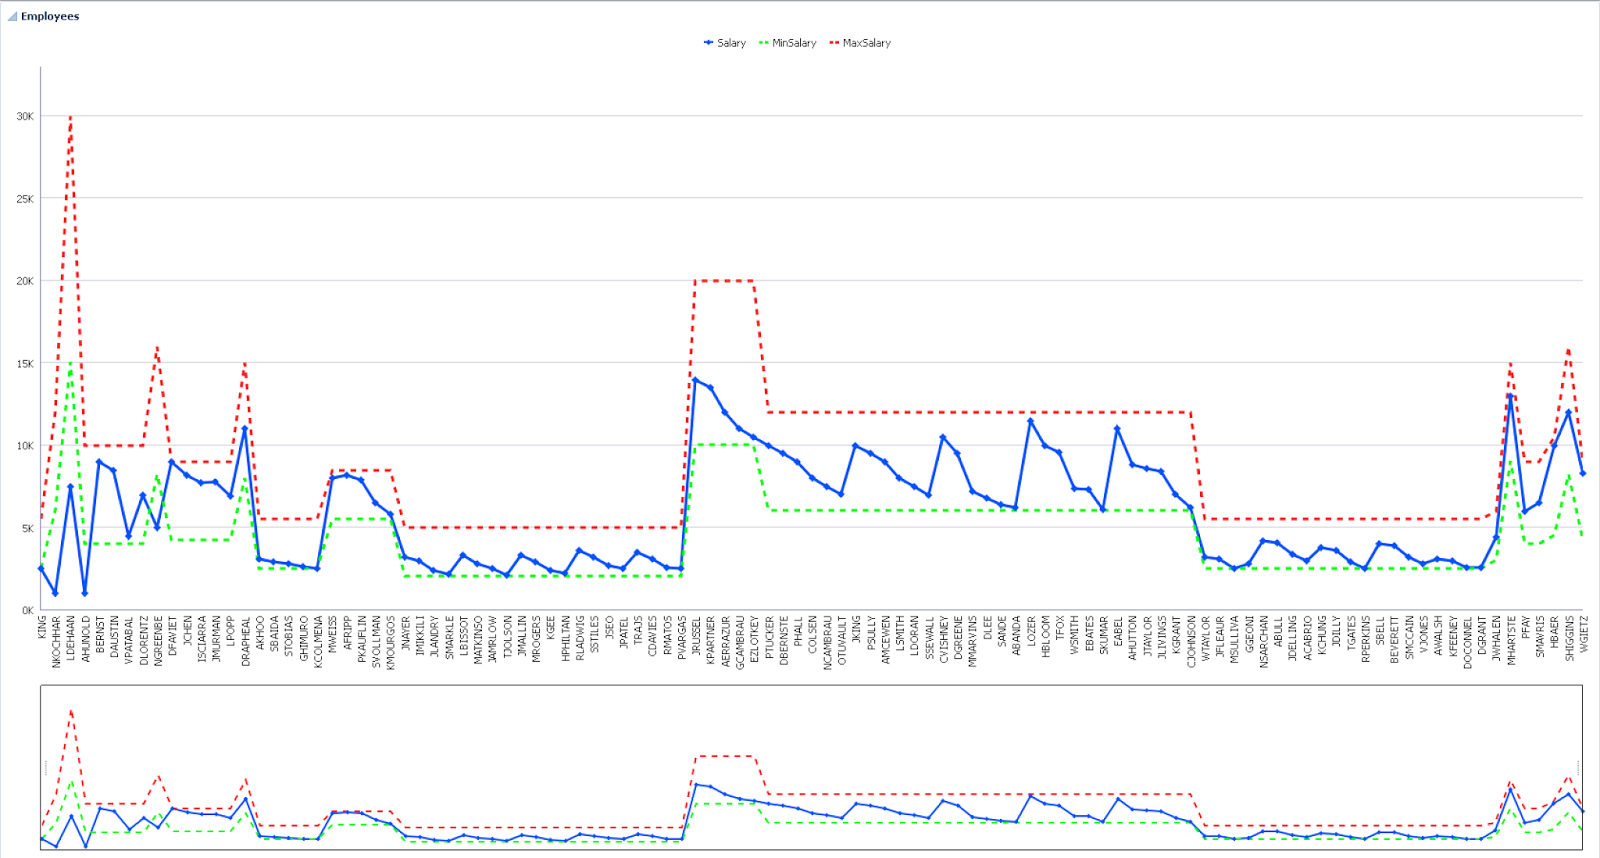
Line chart is configured with zooming and overview support. User can change overview window and zoom into specific area:

This helps a lot to analyse charts with large number of data points on X axis. User can zoom into peaks and analyse data range:
One important hint about new DVT charts - components should stretch automatically. Keep in mind -parent component (surrounding DVT chart) should be stretchable. As you can see, I have set type = 'stretch' for panel box, surrounding line chart:

Previous DVT graphs had special binding elements in Page Definition, new DVT charts are using regular table bindings - nothing extra:

Line chart in the sample application is configured with zooming and scrolling (there are different modes available - live, on demand with delay):
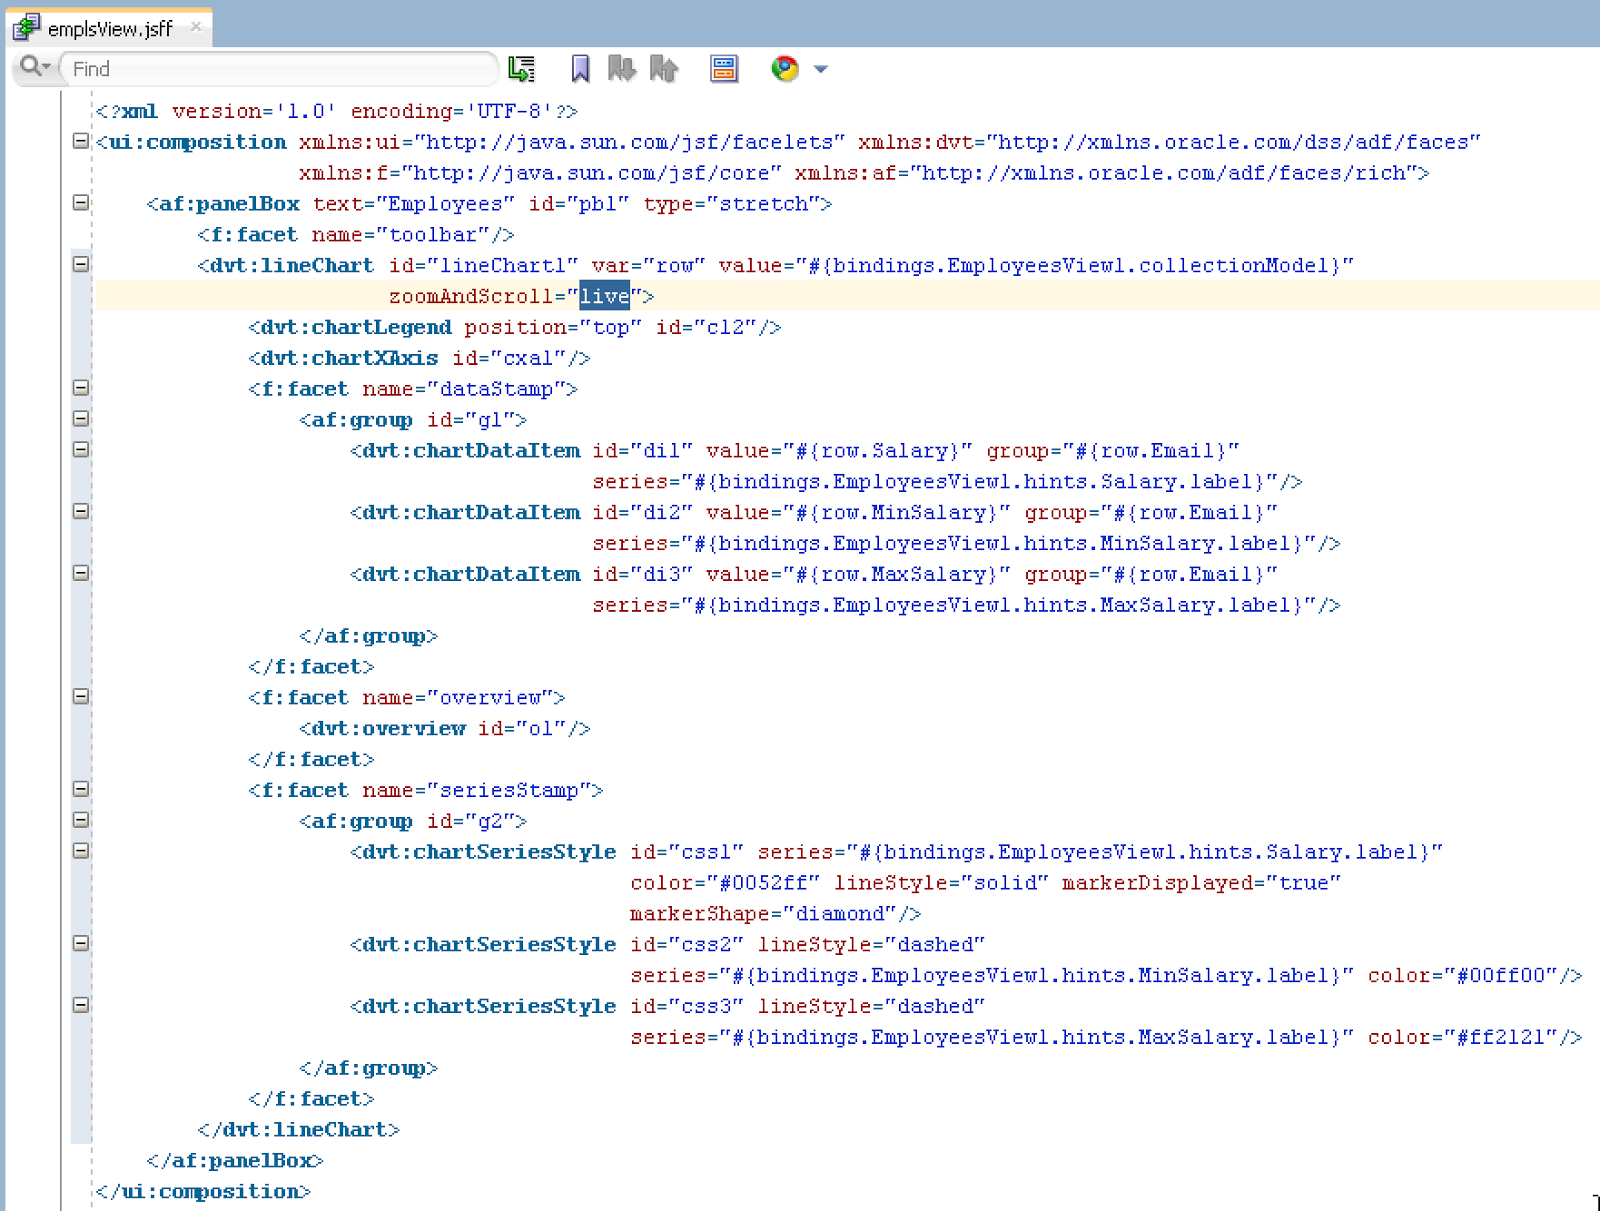
Overview feature is quite simple to enable - it is enough to add DVT overview tag to the line chart, and it works:
